BAYESIAN ANALYSES IN PHYLOGENETIC PALAEONTOLOGY: INTERPRETING THE POSTERIOR SAMPLE
April Wright, Southeastern Louisiana University
July 28, 2020
Bayesian Phylogenetics
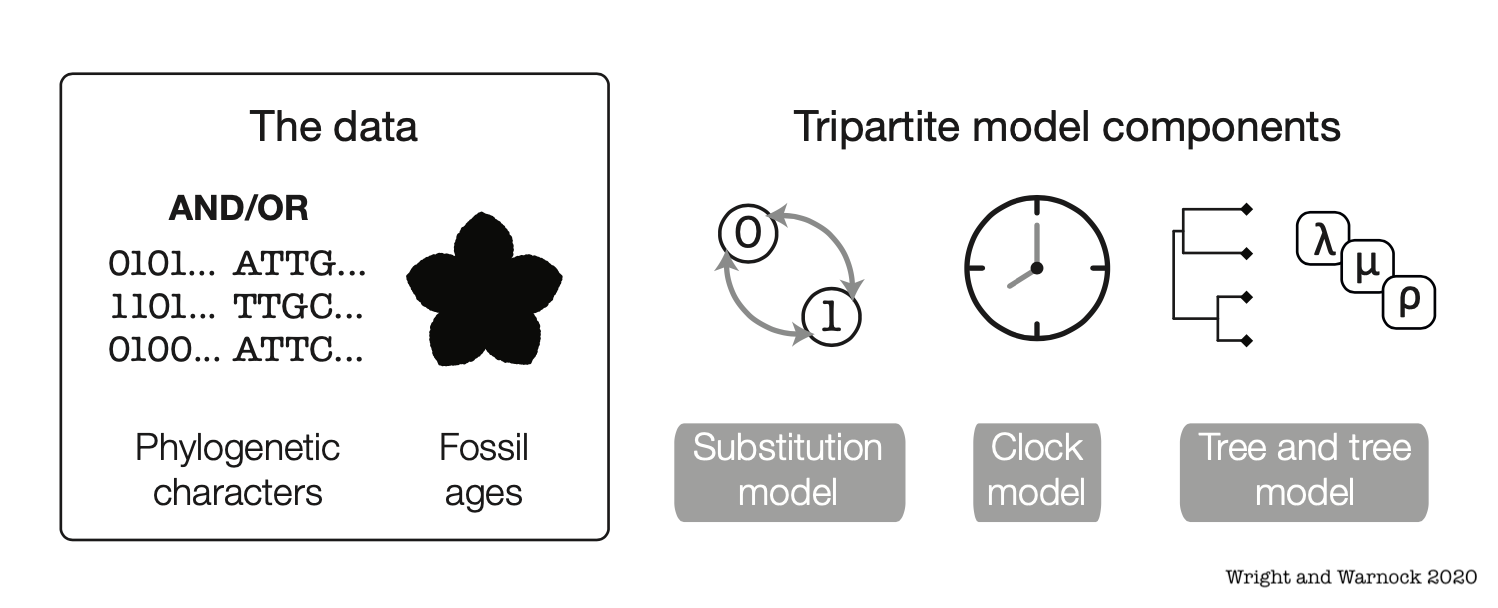
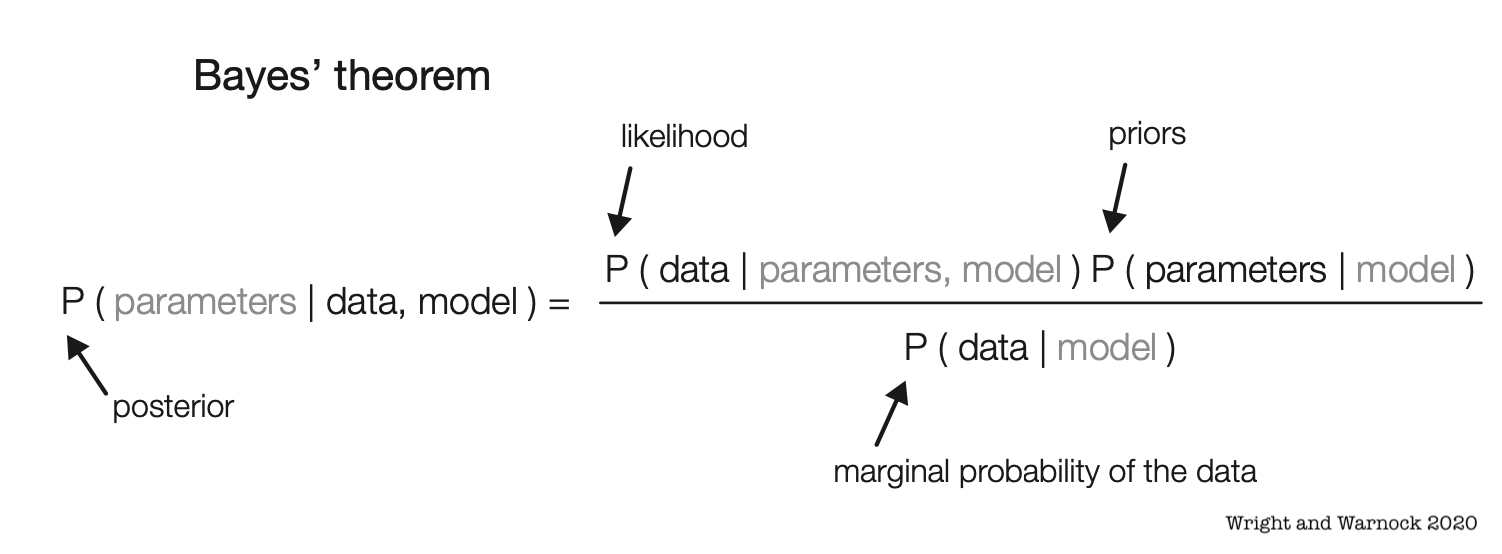
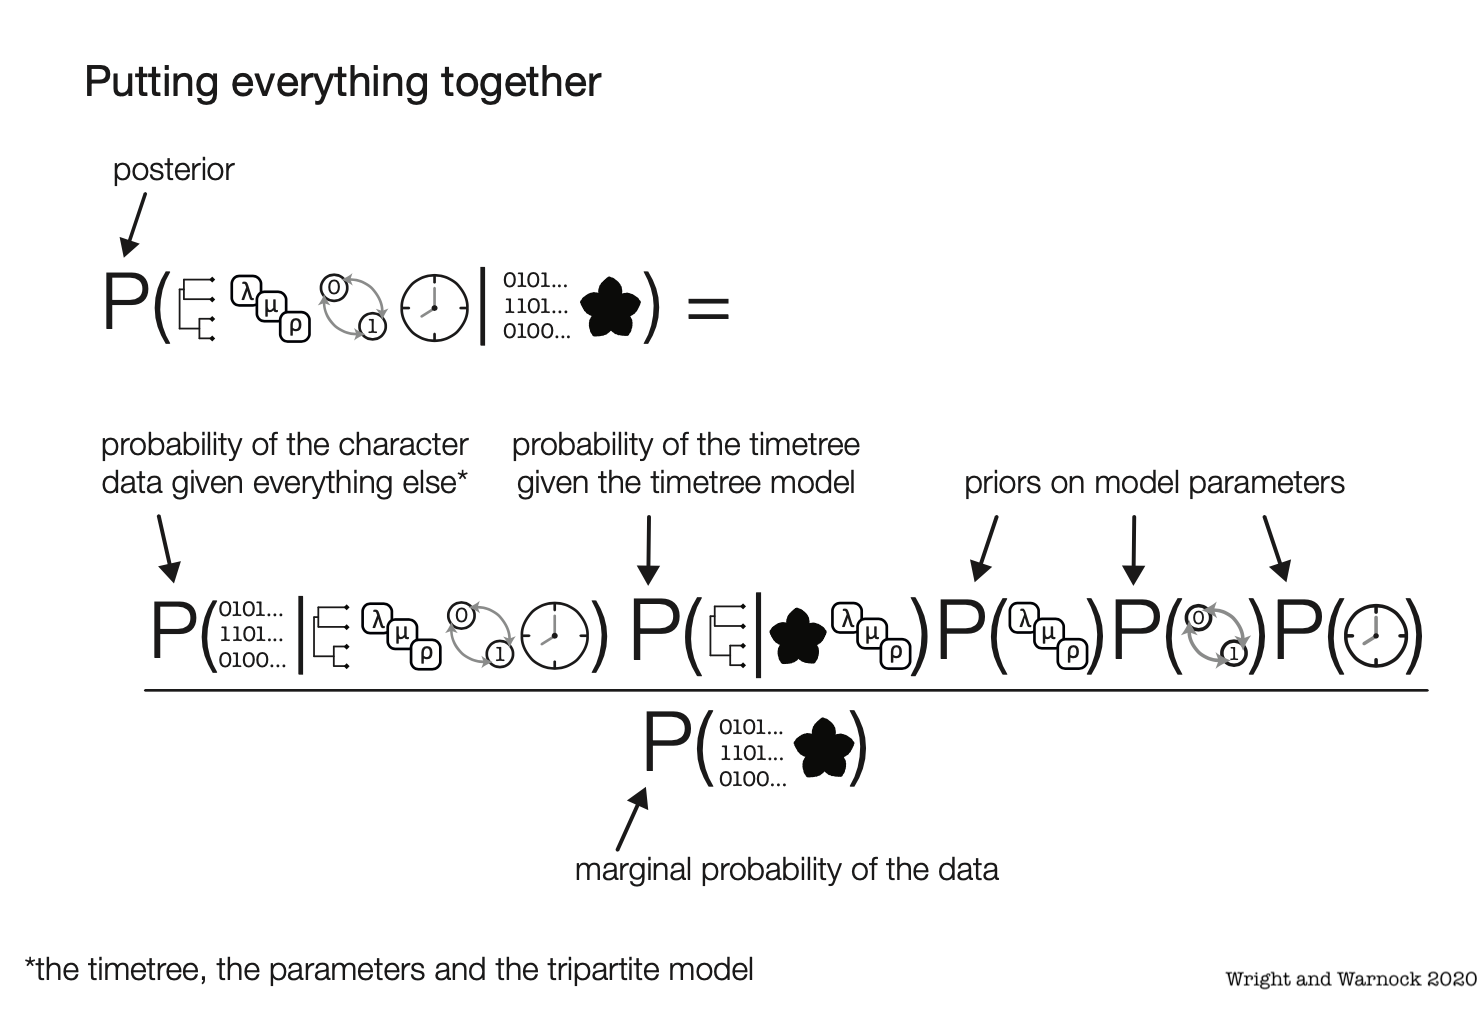
Estimate combinations of the tree topology + parameters that are plausible given a phylogenetic model and data
Bayesian Phylogenetics
Estimate combinations of the tree topology + parameters that are plausible given a phylogenetic model and data
![]()
Bayesian Phylogenetics
Estimate combinations of the tree topology + parameters that are plausible given a phylogenetic model and data
![]()
Bayesian Phylogenetics
Estimate combinations of the tree topology + parameters that are plausible given a phylogenetic model and data
![]()
Bayesian Phylogenetics
Estimate combinations of the tree topology + parameters that are plausible given a phylogenetic model and data
![]()
Bayesian Phylogenetics
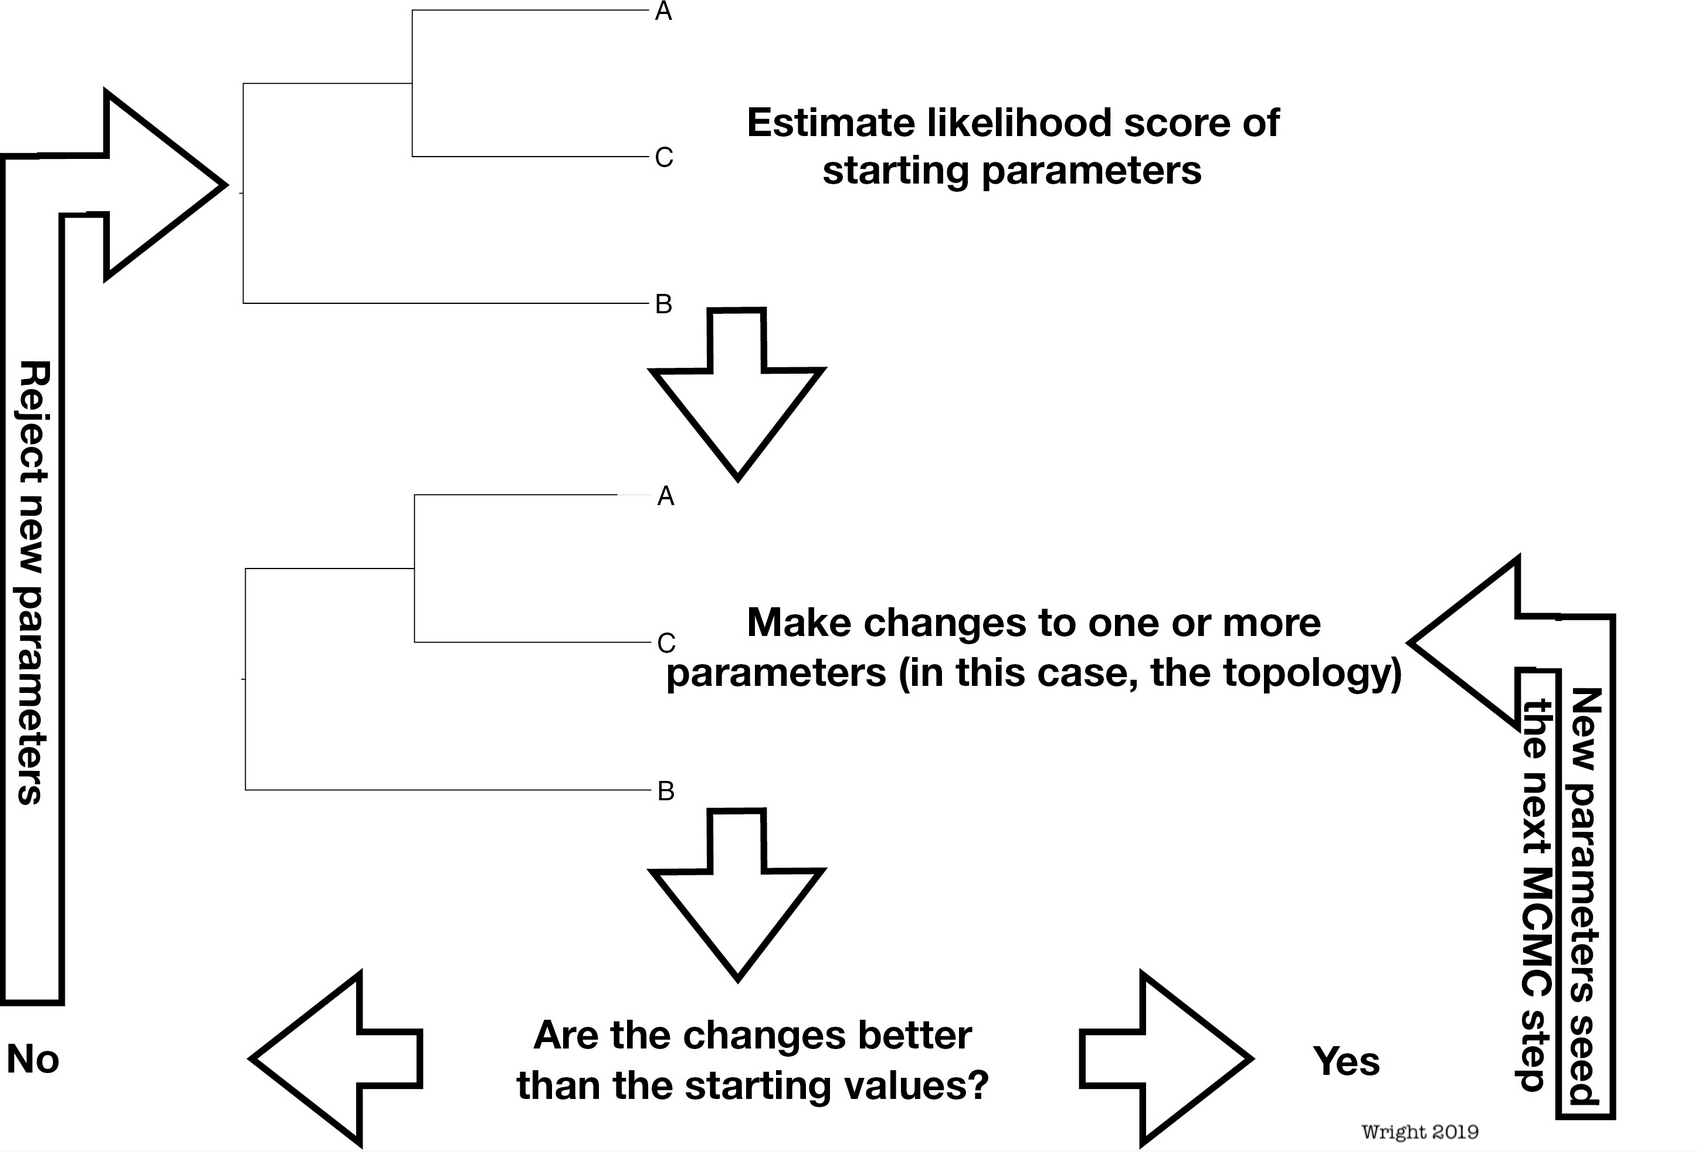
Estimate combinations of the tree topology + parameters that are plausible given a phylogenetic model and data
- Solutions are visited in proportion to how likely they are
Bayesian Phylogenetics
Estimate combinations of the tree topology + parameters that are plausible given a phylogenetic model and data
- Solutions are visited in proportion to how likely they are
- A good tree will be visited many times
Bayesian Phylogenetics
Estimate combinations of the tree topology + parameters that are plausible given a phylogenetic model and data
- Solutions are visited in proportion to how likely they are
- A good tree will be visited many times
- The distribution of solutions is information
Bayesian Phylogenetics
This is a contrast with other methods
A forest or a tree
![]()
A forest or a tree
![]()
A forest or a tree
![]()
A forest or a tree
![]()
What is a phylogeny?
- A hypothesis about relationships between the tips of the tree
What is a phylogeny?
- A hypothesis about relationships between the tips of the tree
- Which means we’re estimating divergences that occurred millions of years ago
What is a phylogeny?
- A hypothesis about relationships between the tips of the tree
- Which means we’re estimating divergences that occurred millions of years ago
- In contemporary methods, such as the fossilized birth-death, we may be estimating values for a lot of parameters
Phylogenetic data
- In our best-sampled groups, we often have patchy species and locus coverage
Phylogenetic data
- In our best-sampled groups, we often have patchy species and locus coverage
- In the fossil record, we might hope to be able to sample a miniscule fragment of paleodiversity
Phylogenetic data
- In our best-sampled groups, we often have patchy species and locus coverage
- In the fossil record, we might hope to be able to sample a miniscule fragment of paleodiversity
- With known biases, such as hard parts fossilization, or fossilization associated with life history or ecology traits
Phylogenetic data
Ultimately, we are often estimating long-ago events from biased and scarce data.
Phylogenetic data
The best thing we can be is humble
Phylogenetic data
The best thing we can be is humble
and that means becoming friendly with uncertainty
So how do we think about the posterior?
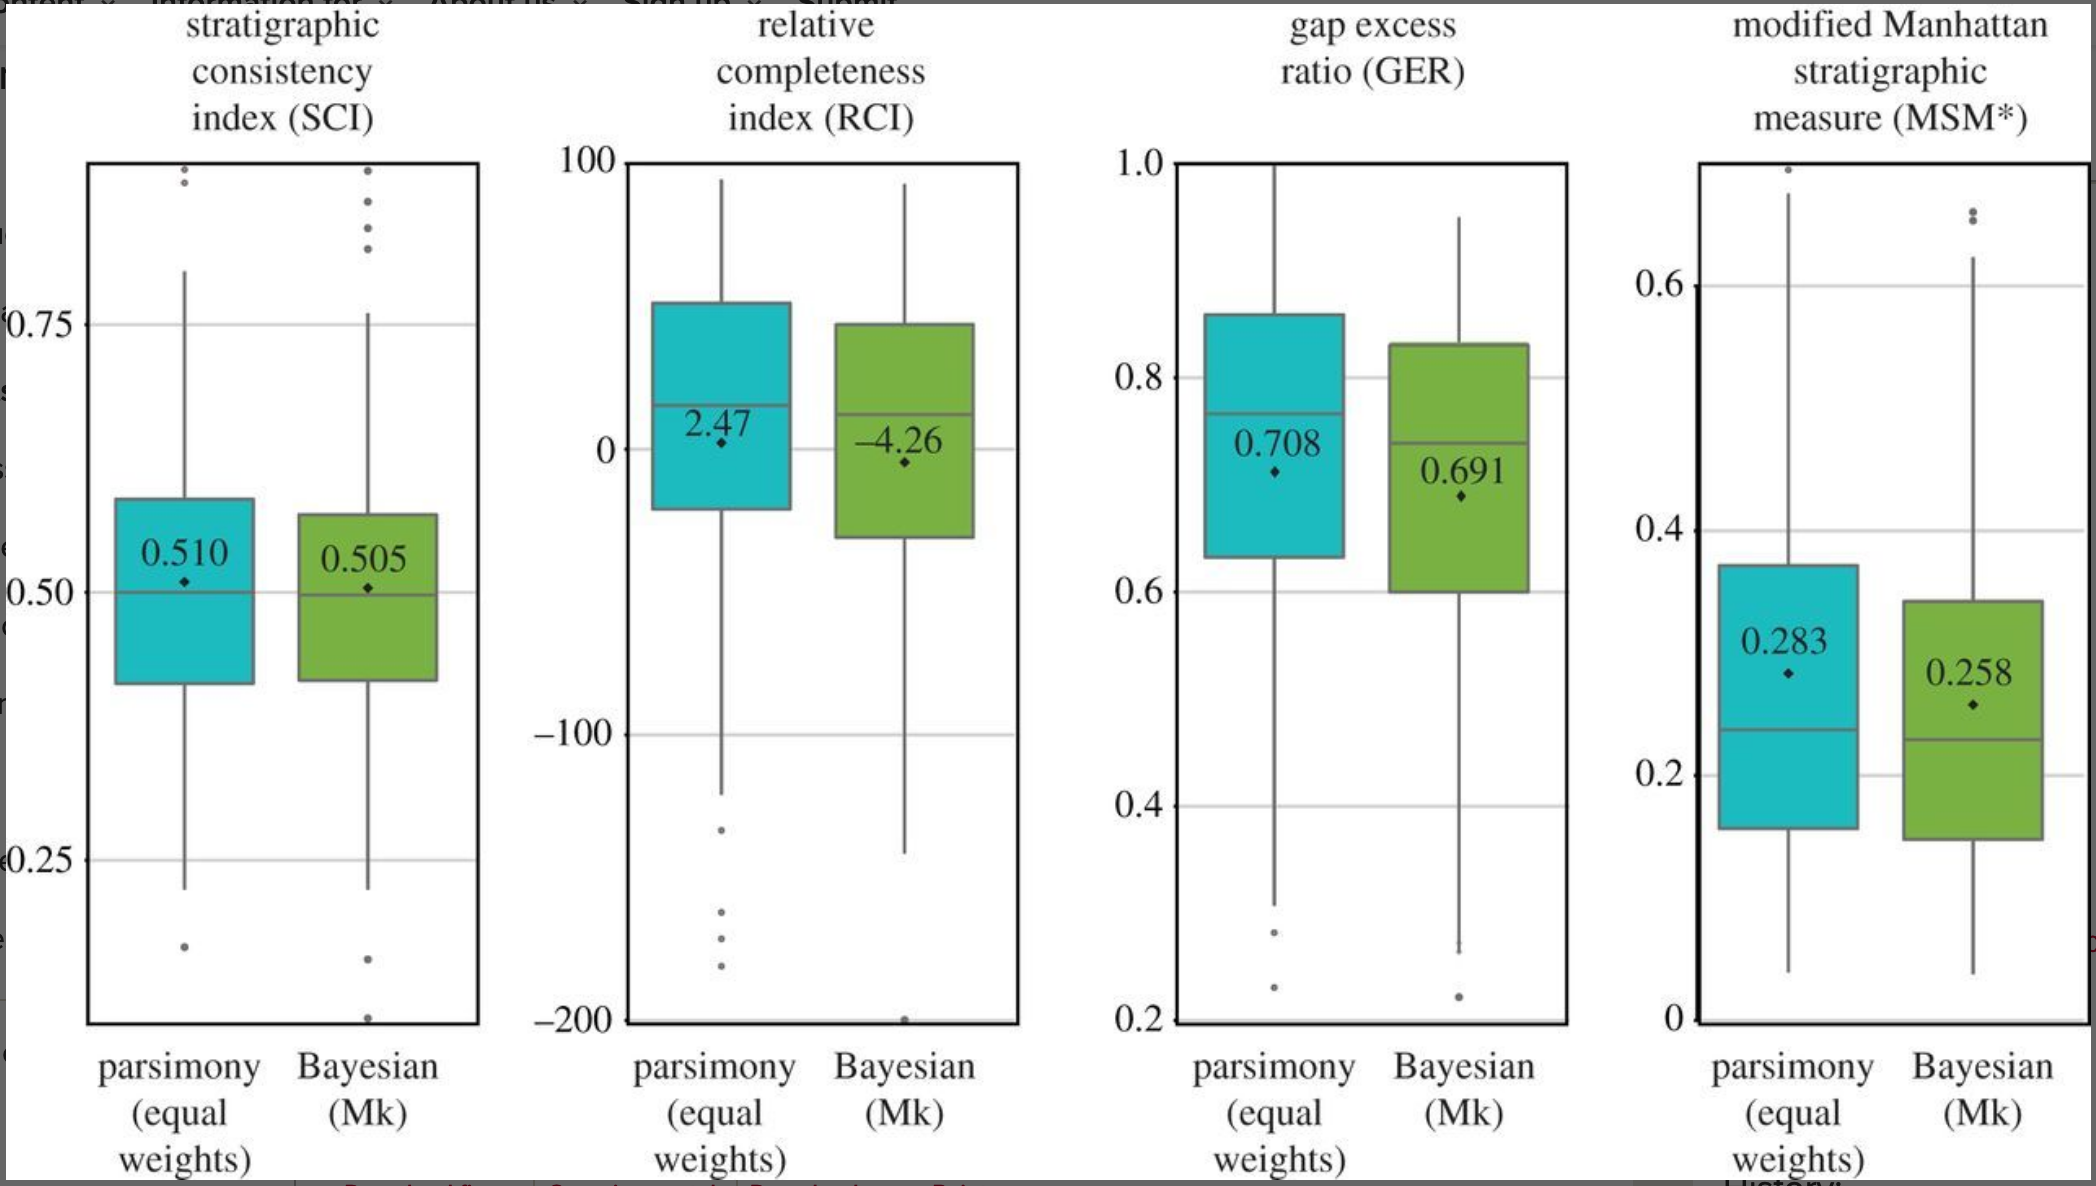
In 2018, Sansom et al. did a comparison between Bayesian and parsimony trees using measures of stratigraphic congruence ![]()
So how do we think about the posterior?
Concluded parsimony trees have better stratigraphic congruence ![]()
So how do we think about the posterior?
There are many ways to measure stratigraphic congruence
| Stratigraphic Consistency Index (SCI) |
Proportion of nodes for which the oldest descendent of that node is younger than the oldest descendent of that node’s ancestor |
0 to 1, with one being perfectly consistent |
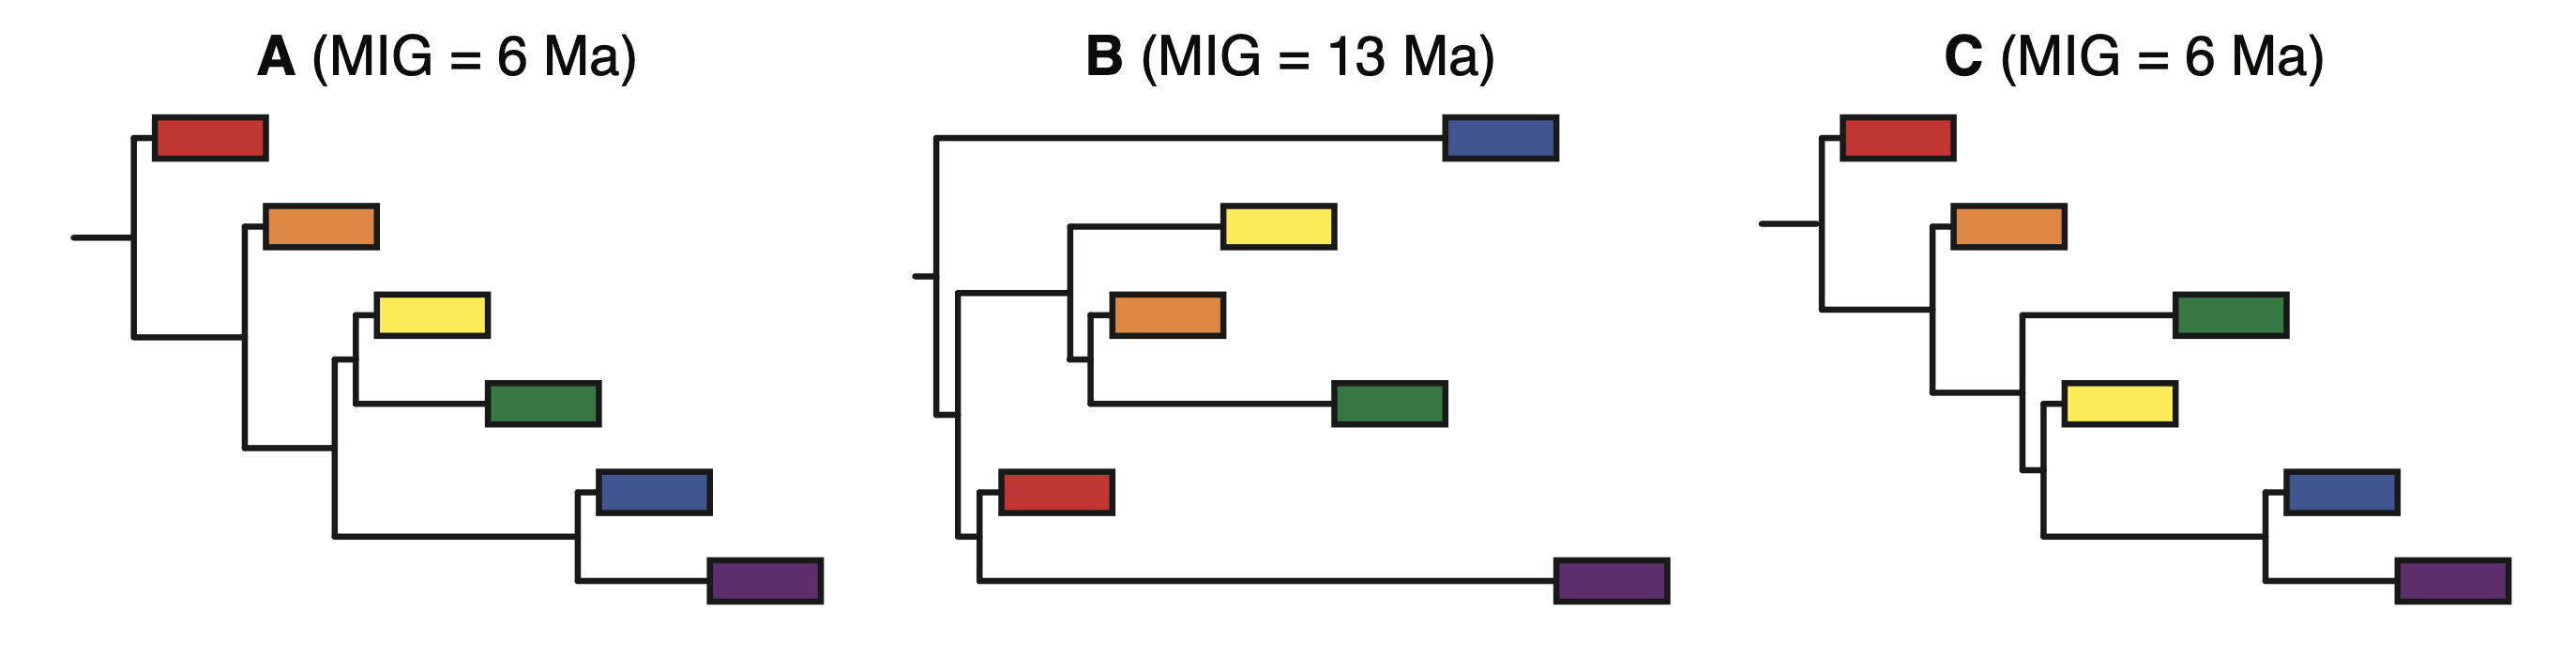
| Minimum Implied Gap (MIG) |
The sum of the branch lengths excluding tip durations |
Positive numbers in millions of years |
| Relative Completeness Index (RCI) |
MIG score proportional to the summed length of tip durations |
All real numbers |
| Manhattan Stratigraphic Measure (MSM*) |
MIG for the maximally stratigraphically consistent possible tree divided by the actual MIG |
0 to 1, with one being the most consistent |
| Gap Excess Ratio (GER) |
MIG minus the best possible stratigraphic fit, scaled by the contrast between the best and worst fit values |
0 to 1, with one being the most consistent |
So how do we think about the posterior?
These metrics quantify how consistent a phylogeny is with the rock record
| Stratigraphic Consistency Index (SCI) |
Proportion of nodes for which the oldest descendent of that node is younger than the oldest descendent of that node’s ancestor |
0 to 1, with one being perfectly consistent |
| Minimum Implied Gap (MIG) |
The sum of the branch lengths excluding tip durations |
Positive numbers in millions of years |
| Relative Completeness Index (RCI) |
MIG score proportional to the summed length of tip durations |
All real numbers |
| Manhattan Stratigraphic Measure (MSM*) |
MIG for the maximally stratigraphically consistent possible tree divided by the actual MIG |
0 to 1, with one being the most consistent |
| Gap Excess Ratio (GER) |
MIG minus the best possible stratigraphic fit, scaled by the contrast between the best and worst fit values |
0 to 1, with one being the most consistent |
So how do we think about the posterior?
Sansom et al. took 500 samples from the posterior and compared those with the most parsimonious tree ![]()
So how do we think about the posterior?
But is there more information in the posterior than a random sample can show us? ![]()
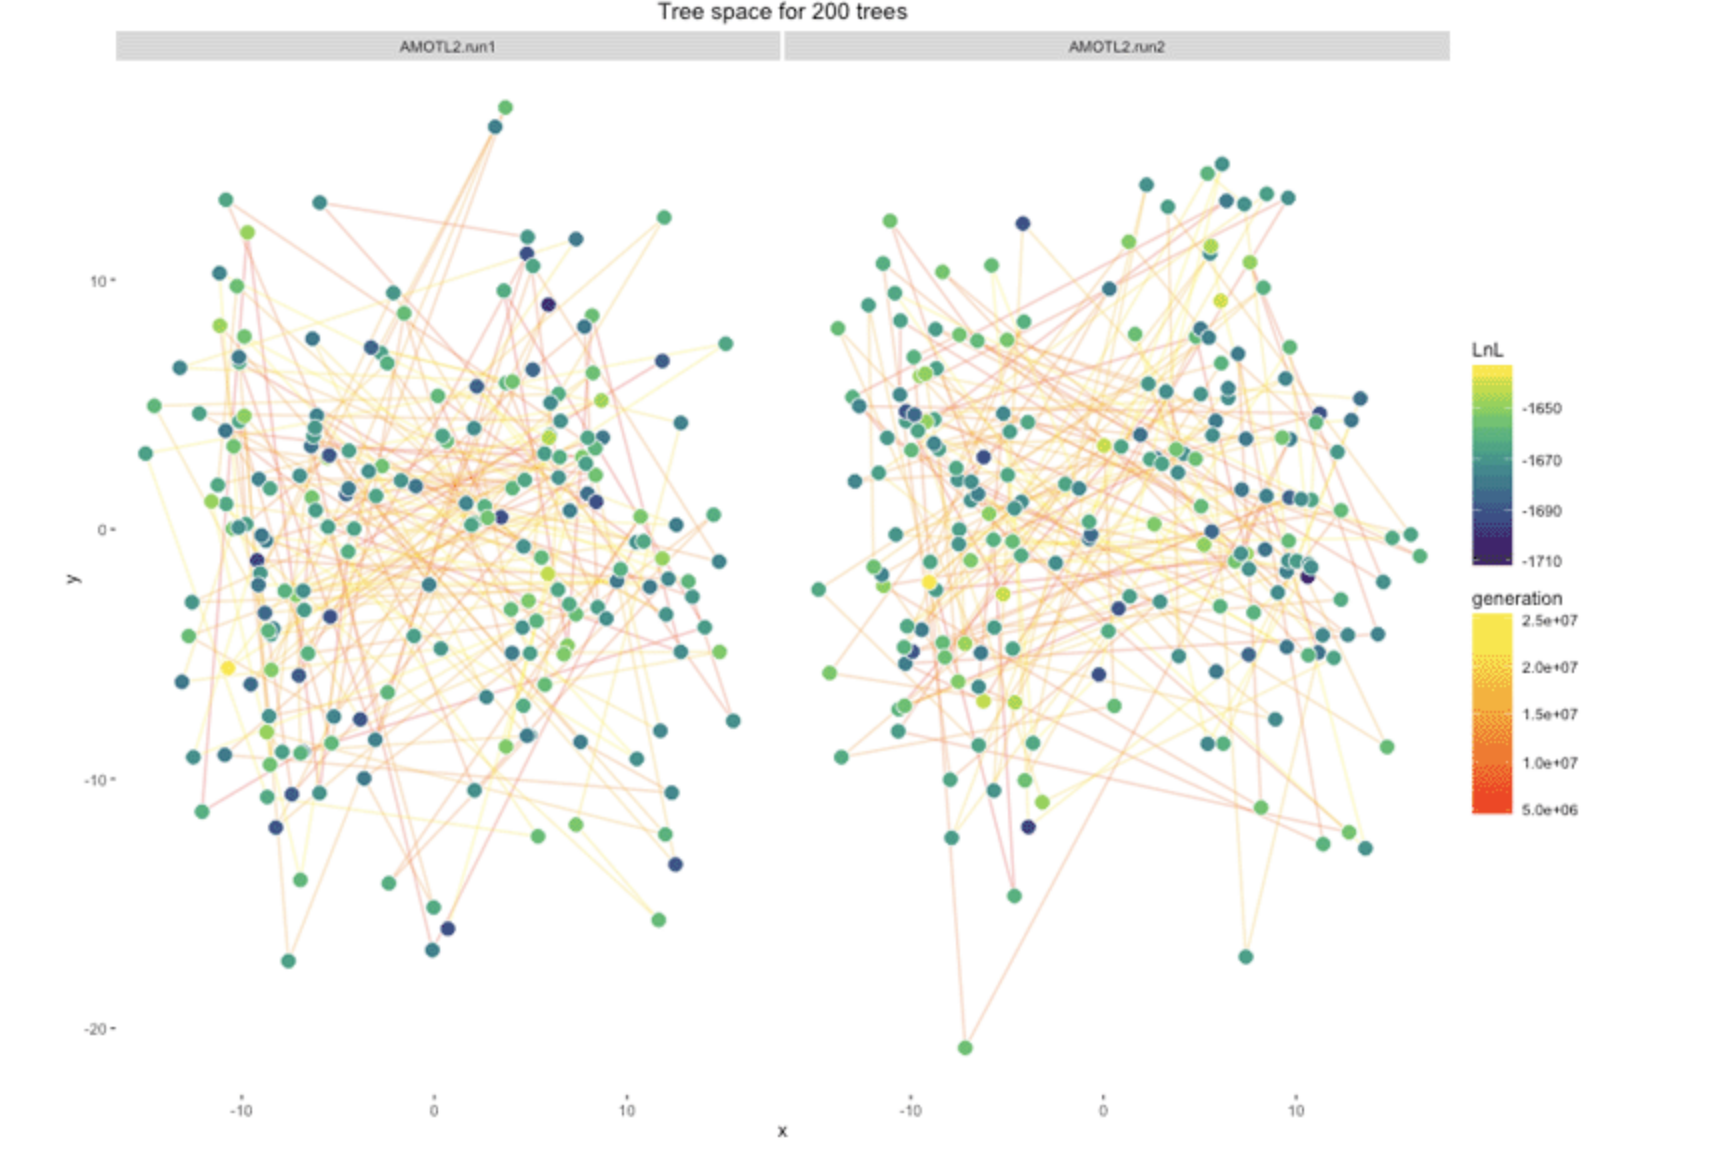
Treeset visualizations
Graphics that display trees in 2-D space based on their proximity to one another ![]()
Treeset visualizations
Could these be a valuable tool for looking at the posterior sample?
Treeset visualizations
Is this how we see our forest? ![]()
Methods
- Estimated parsimony trees (TNT, Goloboff and Catalano 2016) and Bayesian trees (Hoehna et al 2016) for 127 published paleontological matrices
Methods
Estimated parsimony trees (TNT, Goloboff and Catalano 2016) and Bayesian trees (Höhna et al 2016) for 127 published paleontological matrices
Calculated stratigraphic congruence for all equally-parsimonious trees and the Bayesian posterior sample in the R package Strap (Bell and Lloyd 2015)
Methods
Estimated parsimony trees (TNT, Goloboff and Catalano 2016) and Bayesian trees (Hoehna et al 2016) for 127 published paleontological matrices
Calculated stratigraphic congruence for all equally-parsimonious trees and the Bayesian posterior sample in the R package Strap (Bell and Lloyd 2015)
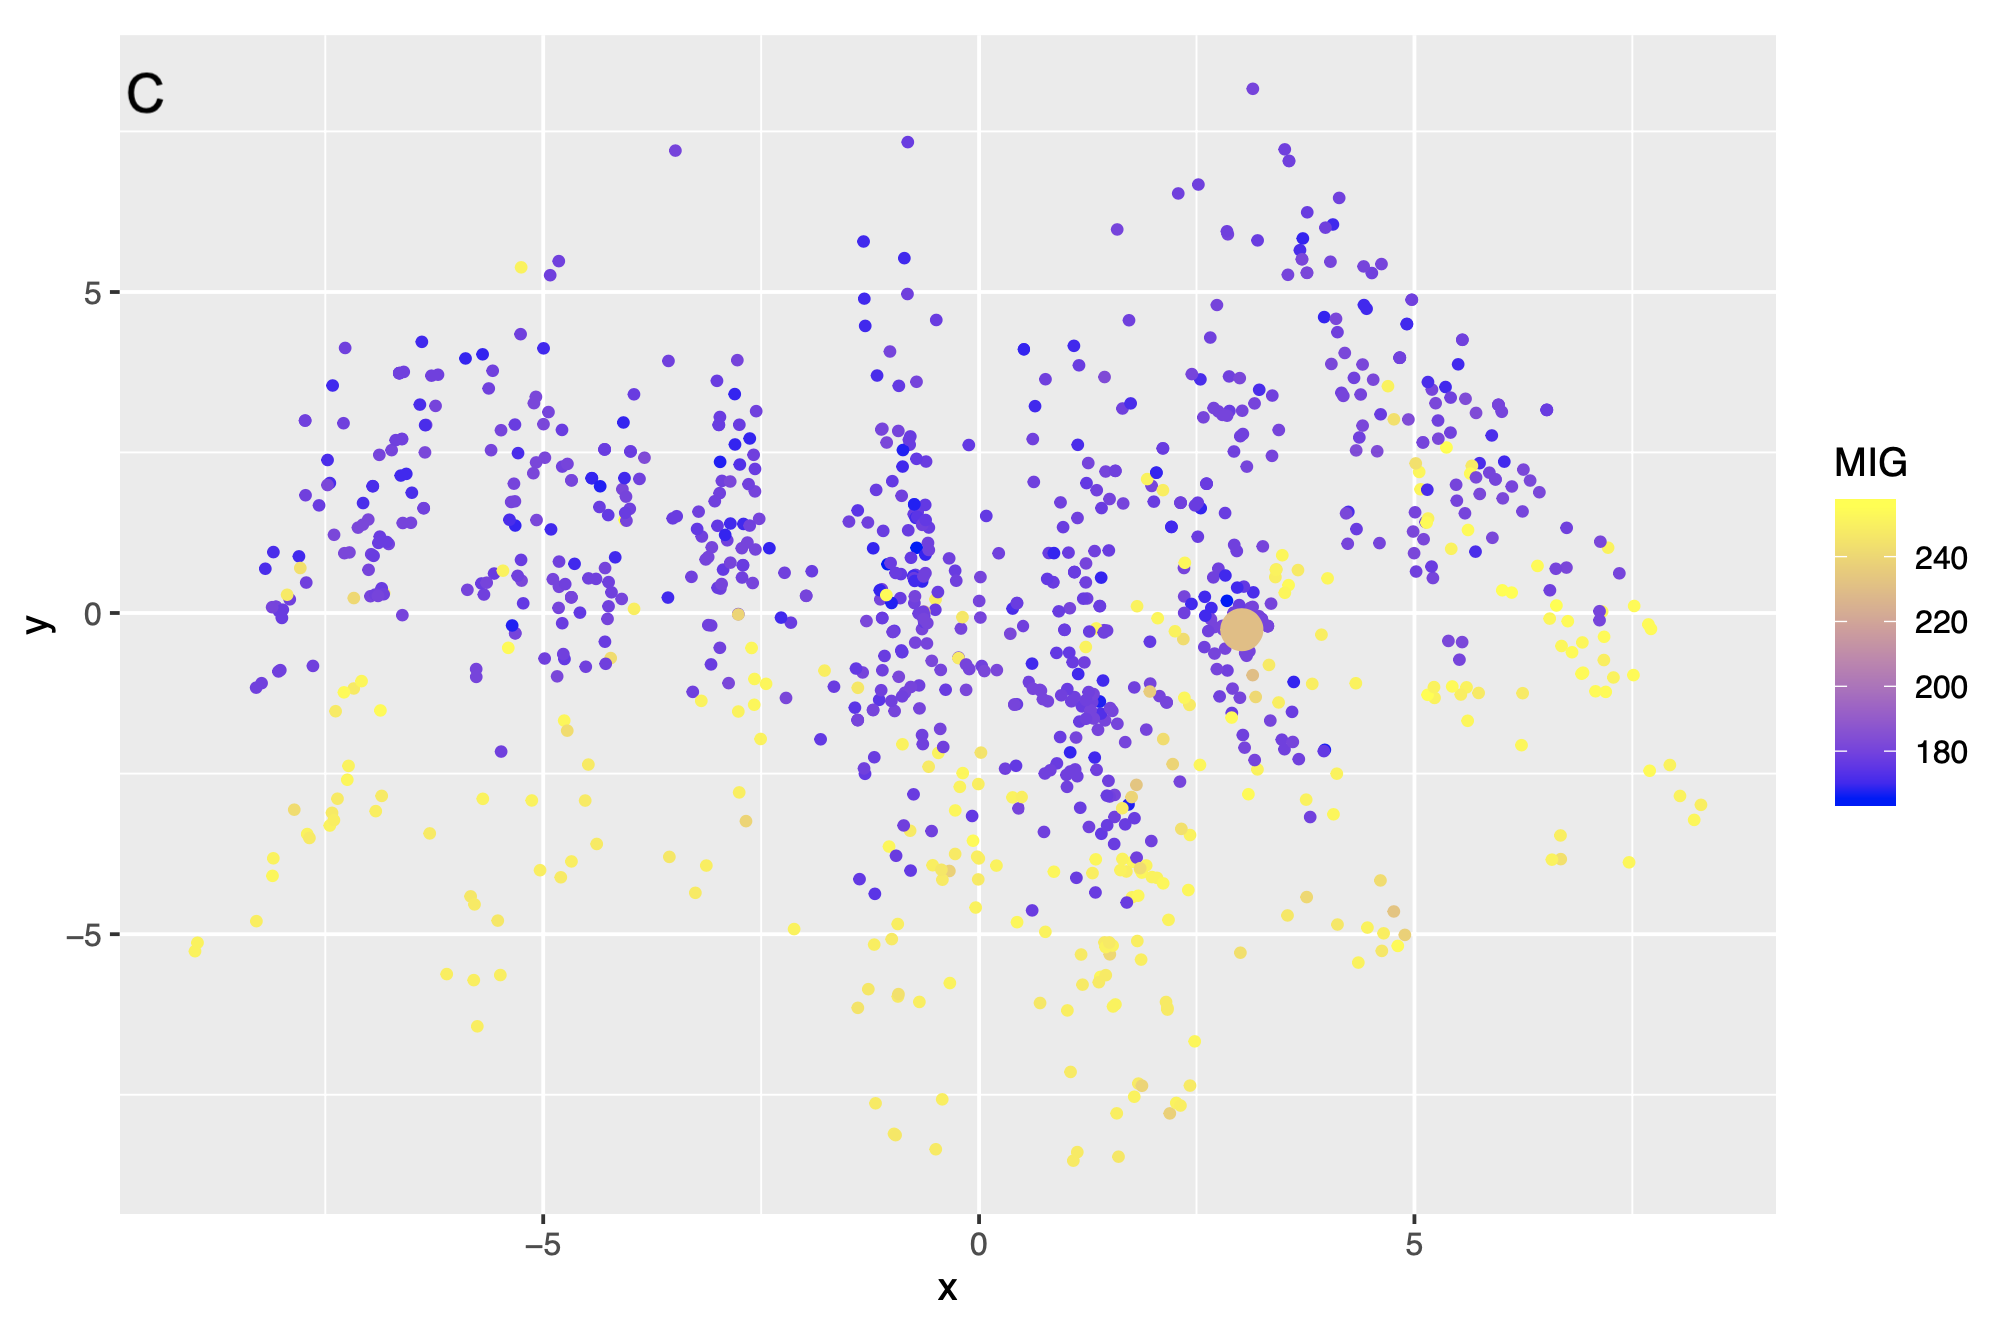
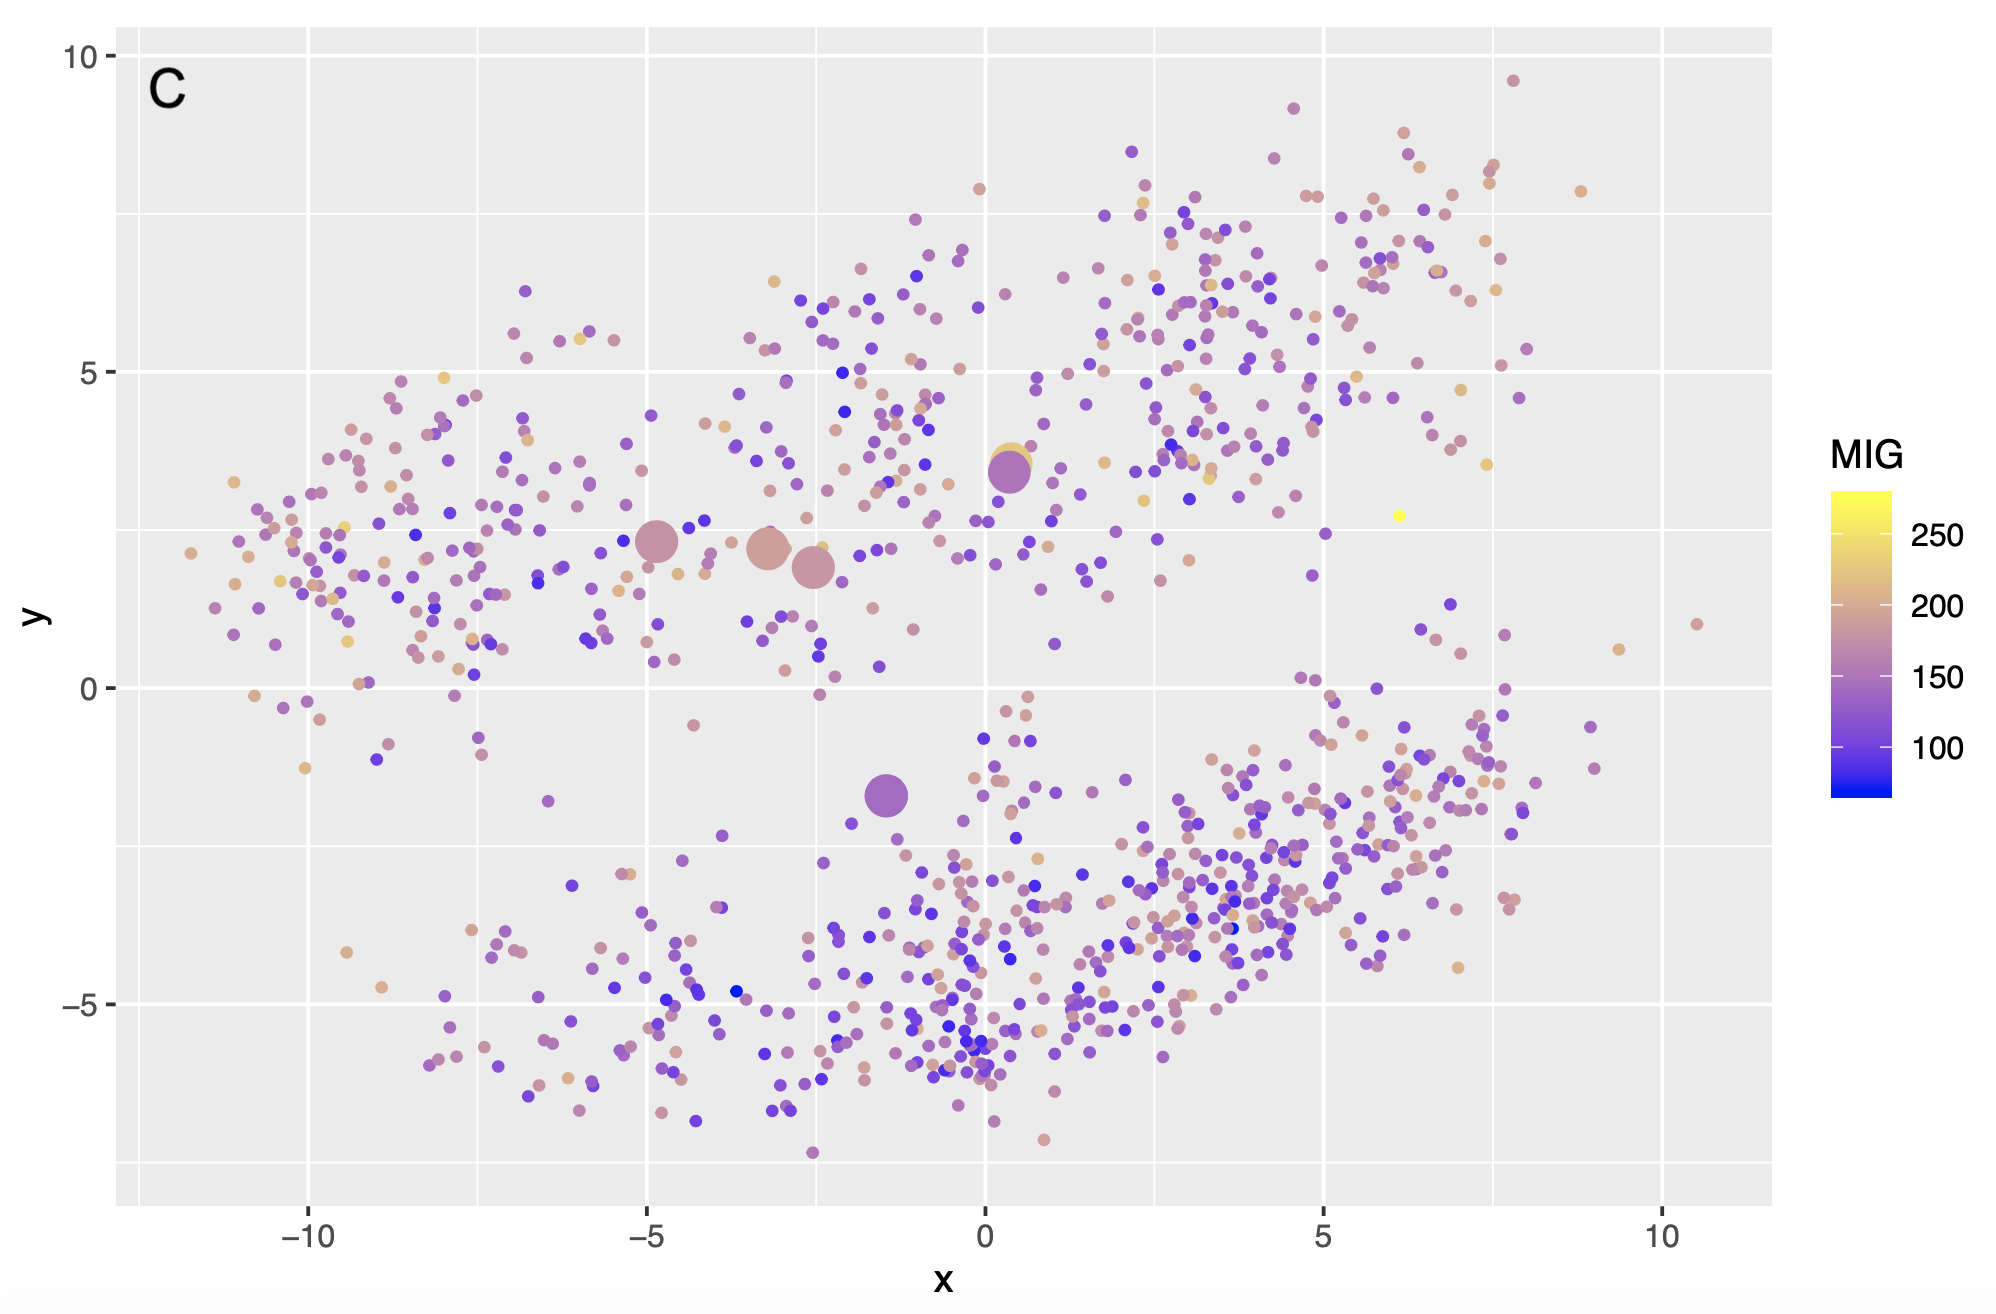
Modified the RWTY (Warren, Geneva and Lanfear 2017) to color points in the treespace by MIG score
Methods
Estimated parsimony trees (TNT, Goloboff and Catalano 2016) and Bayesian trees (Hoehna et al 2016) for 127 published paleontological matrices
Calculated stratigraphic congruence for all equally-parsimonious trees and the Bayesian posterior sample in the R package Strap (Bell and Lloyd 2015)
Modified the RWTY (Warren, Geneva and Lanfear 2017) to color points in the treespace by MIG score
Also calculated some basic summary tables across thee datasets using tidyverse
Results
- 63% of datasets had the highest average stratigraphic congruence with parsimony
Results
- 63% of datasets had the highest average stratigraphic congruence with parsimony
- In 94% of datasets the highest stratigraphic congruence value was observed in the Bayesian posterior sample
Results
- 63% of datasets had the highest average stratigraphic congruence with parsimony
- In 94% of datasets the highest stratigraphic congruence value was observed in the Bayesian posterior sample
- In 99% of datasets the lowest stratigraphic congruence was found in the Bayesian posterior sample
Results
- 63% of datasets had the highest average stratigraphic congruence with parsimony
- In 94% of datasets the highest stratigraphic congruence value was observed in the Bayesian posterior sample
- In 99% of datasets the lowest stratigraphic congruence was found in the Bayesian posterior sample
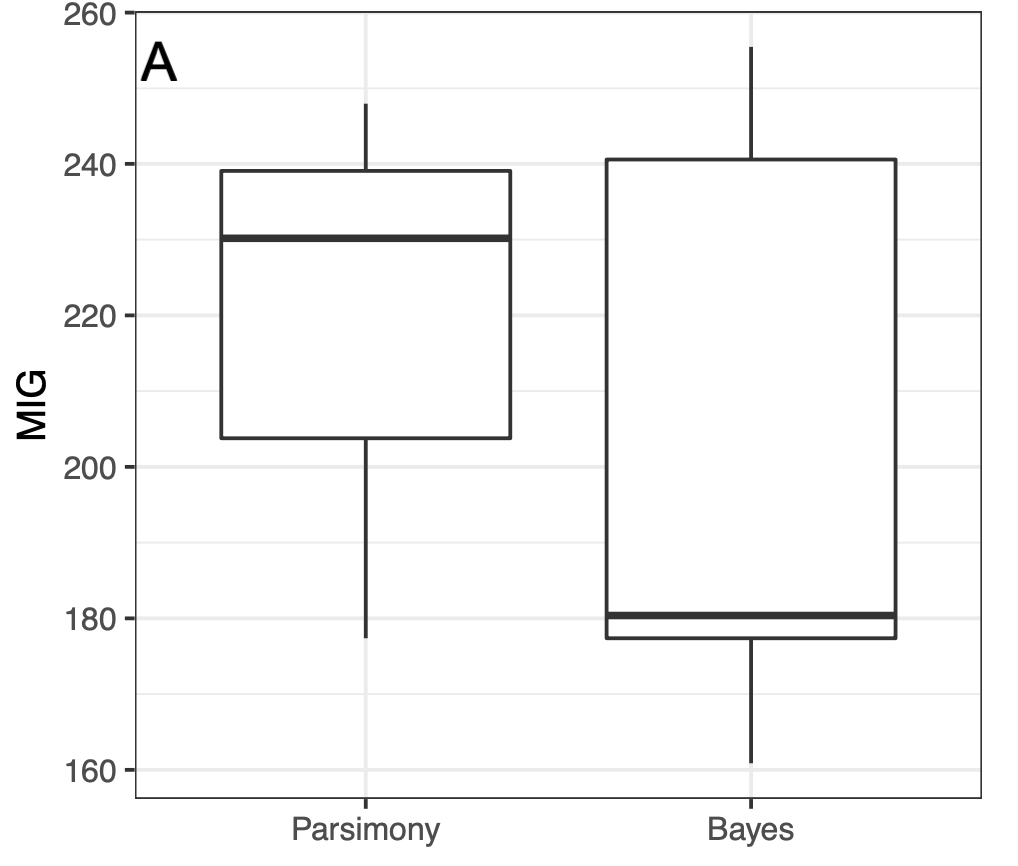
Results
Example dataset: Yates (2003)
![]()
Results
Example dataset: Yates (2003)
![]()
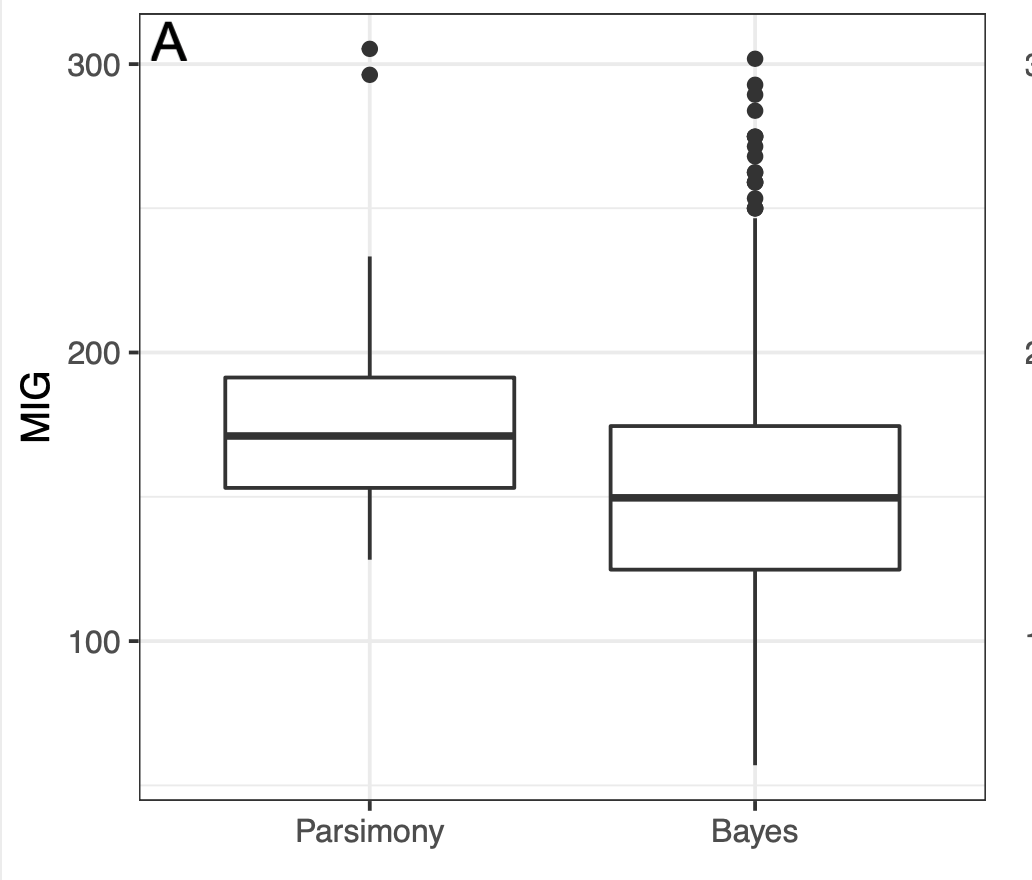
Results
Example dataset: Demar 2013 ![]()
Results
Example dataset: Demar 2013 ![]()
Summary
Bayesian methods estimate a sample of solutions
Summary
Bayesian methods estimate a sample of solutions
Unlike other methods, the distribution itself may be important
Summary
Bayesian methods estimate a sample of solutions
Unlike other methods, the distribution itself may be important
Looking at the full distribution of trees can provide us with information that one solution itself may not
Summary
We shouldn’t be asking “Is Bayes or parsimony better?”
Summary
We shouldn’t be asking “Is Bayes or parsimony better?”
We should instead be looking for ways to comfortably visualize variation in large datasets
Summary
We shouldn’t be asking “Is Bayes or parsimony better?”
We should instead be looking for ways to comfortably visualize variation in large datasets
Treespace visualizations provide an easy and intuitive way to do this
Thank You!
A sincere thank you to the organizers of this excellent event!
To Dan Warren and Rob Lanfear for the endlessly hackable RWTY software
And to my co-author and partner in crime, Dr. Graeme Lloyd
![]()